Causal Loop Diagram (CLD) Exercise: Methodology, Findings, and Policy-Relevant Insights
In a project workshop, the Phoenix team discussed the CLD/STP framework and how to apply it to understand climate‑induced mobility.
1. Introduction: Why CLDs Matter for Understanding Mobility
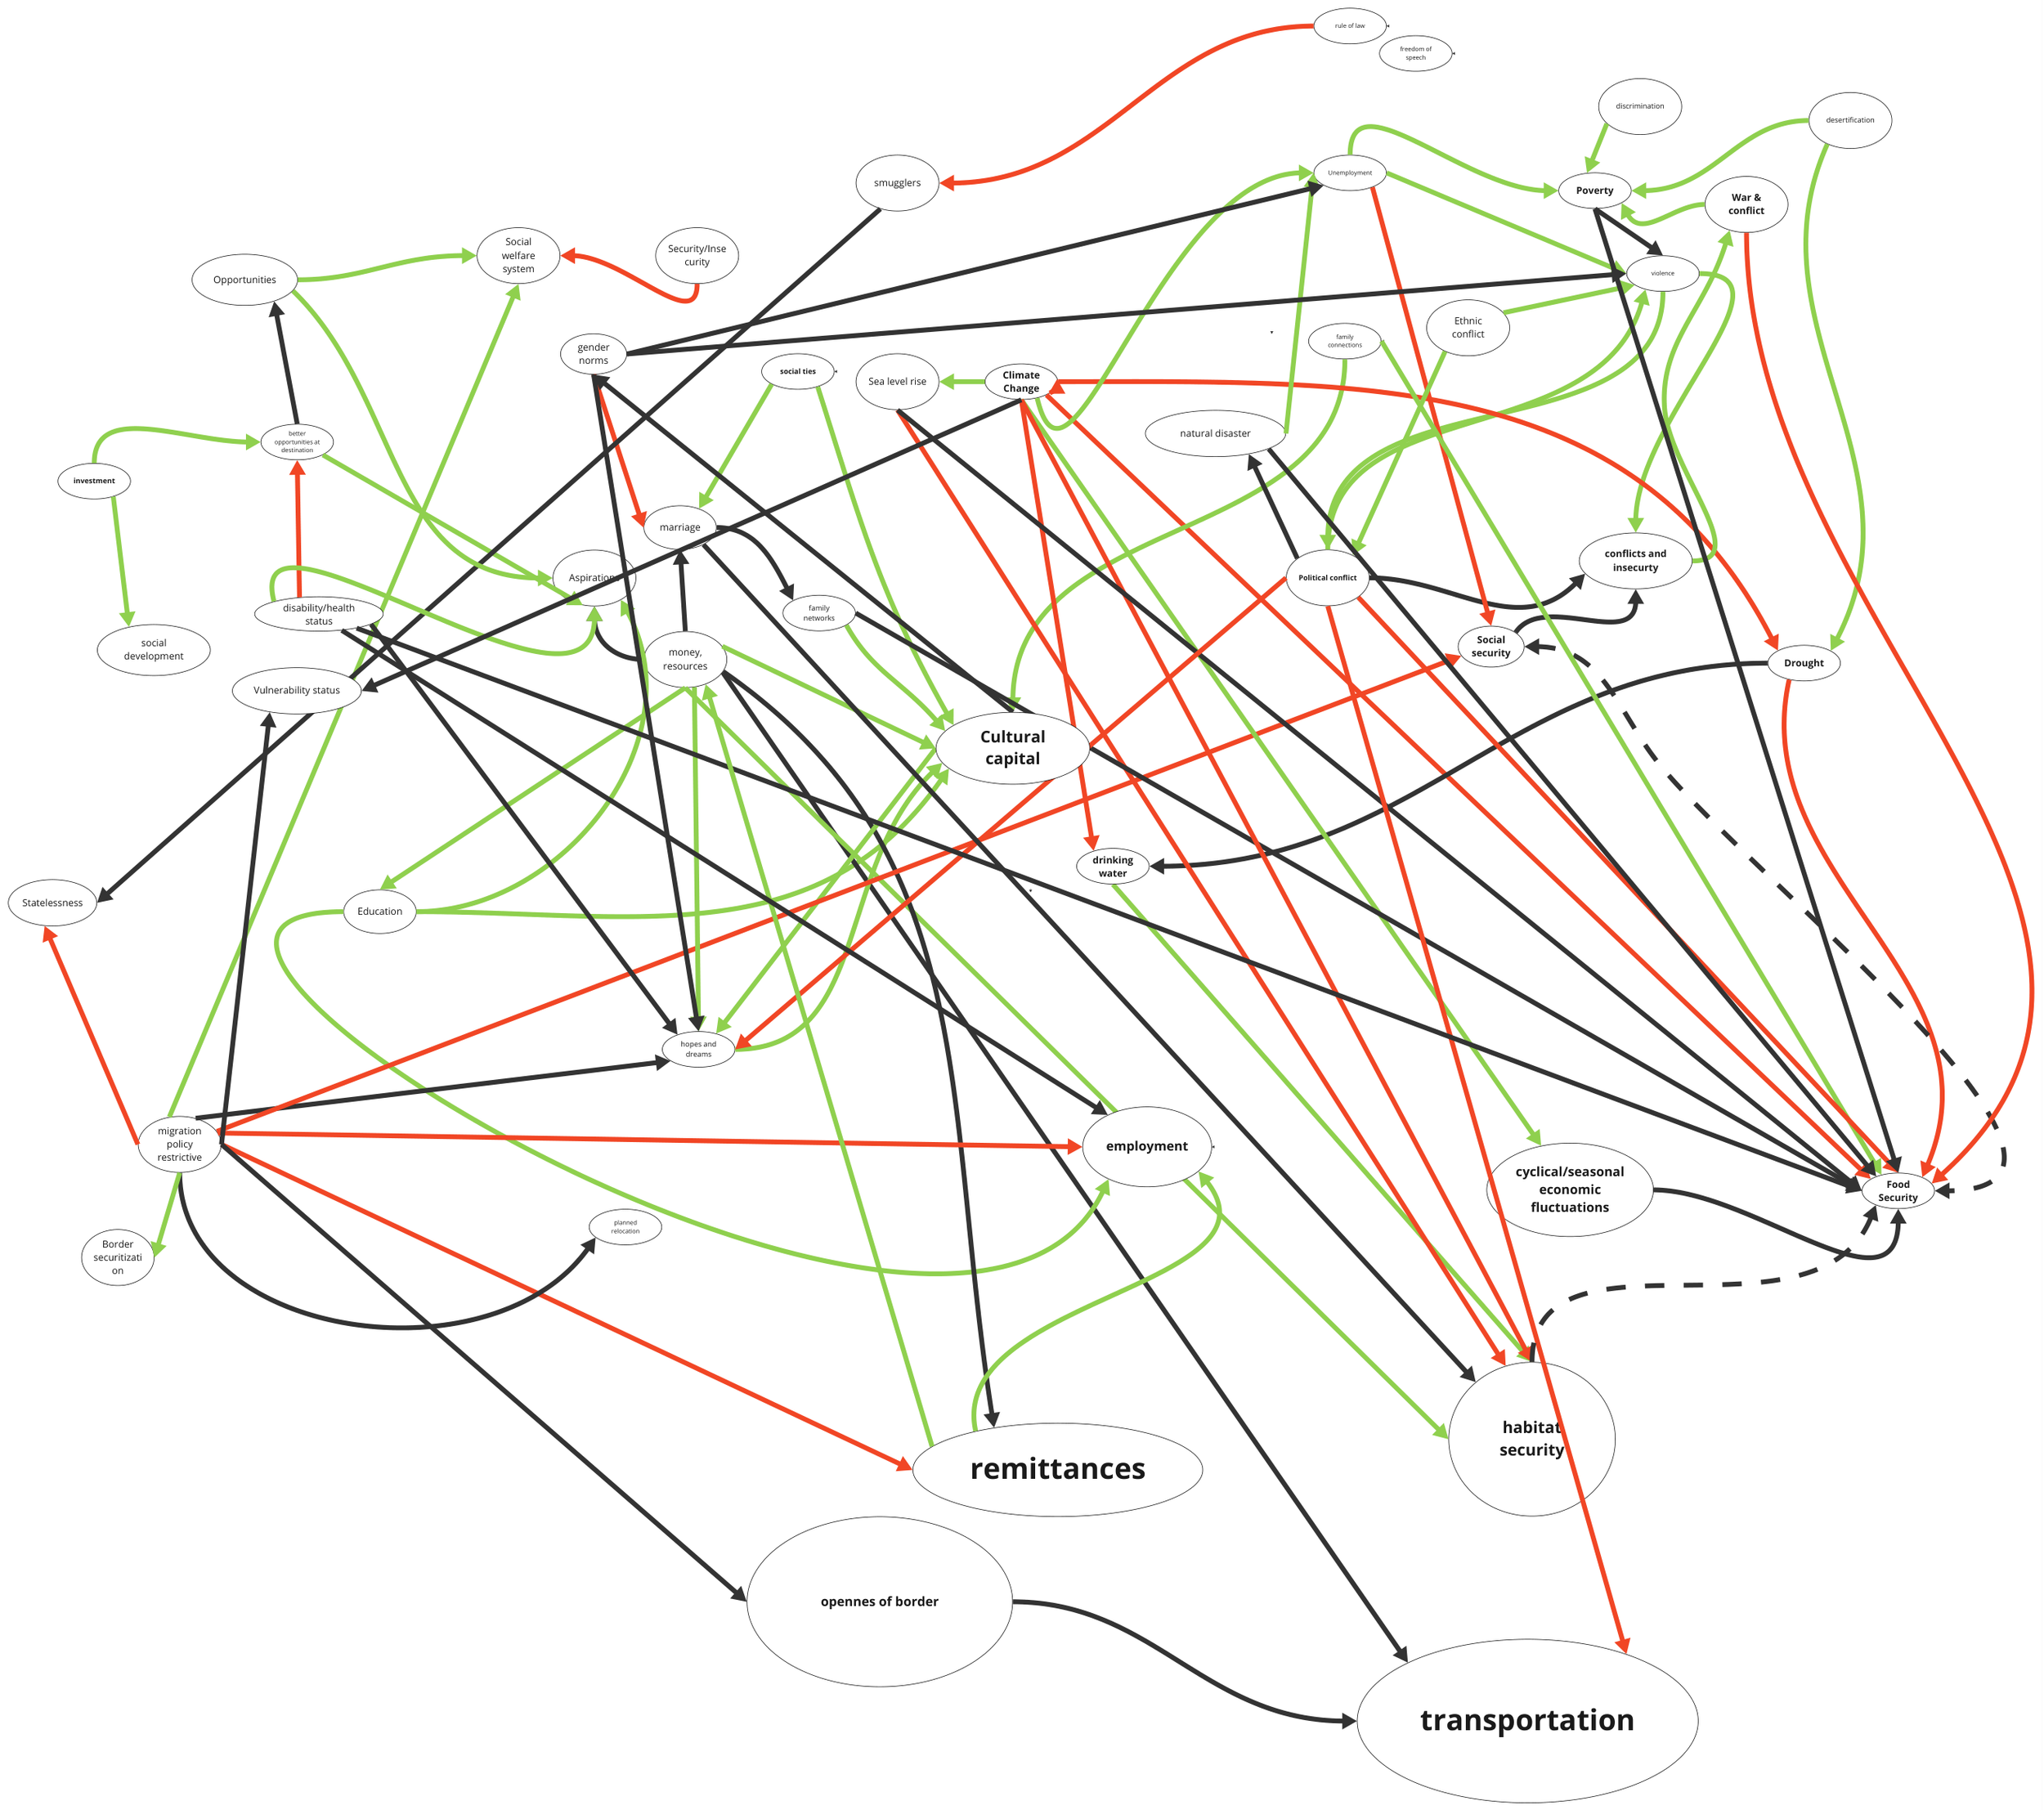
Migration emerges not from a single cause but from the interaction of climate pressures, economic stresses, governance failures, social networks, and individual vulnerability. Causal Loop Diagrams (CLDs) make these relationships visible by tracing how variables influence one another and by identifying feedback loops that either reinforce or stabilize system behavior. In PHOENIX, CLDs are central to identifying potential Social Tipping Points (STPs), moments when gradual pressures accumulate into rapid, non-linear change in mobility patterns.
The CLD developed through this exercise reflects the lived experiences and professional insights of workshop participants. It serves as a bridge between qualitative understanding and the formal STP modelling being developed in Cluster 5, providing the conceptual structure upon which the interactive online model will be built.